Why do I love phase diagrams so much? I've always been fascinated by these relatively cursory-looking plots that show where the phases of matter at different thermodynamic conditions are stable. I remember my excitement in the intro lecture and lab, MATE 25 at SJSU, where in the lab we constructed points on the phase diagram of a lead alloy system. I thought this was the coolest thing that we could build these maps and then use them later to determine what phase a material would be in a given temperature and composition. At the time I had no thermodynamics course work so I didn't realize the underlying driving force of this phenomenon nor did I realize you can calculate these phase diagrams using the CALPHAD method. When I got to grad school I took the required thermodynamics course and then I was even more blown away at how powerful this framework was. I was particularly lucky because the course was taught from a "grassroots" approach where everything was built from the ground up given a set of postulates (you can see the book by H. Callen to get the gist).
So what does a phase diagram look like and how does one use it? Here I'm going to leverage the excellent Python library pycalphad [1]. Which lets you construct phase diagrams using thermochemical databases, if available. Let's take an example of Cu-Ni system, you can work through the CALPHAD calculation with pycalphad in this google colab notebook. Here is the binary phase diagram predicted for Cu-Ni:
 |
| Phase diagram predicted using cost507.tdb and pycalphad. |
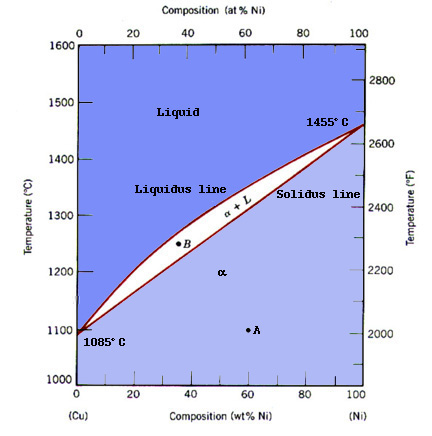 |
| Textbook phase diagram for Cu-Ni from adapted by ref. [1] |
As we see the predicted phase diagram isn't even close to that shown in the textbook version. This is a direct consequence of the thermodynamic database. However, if we use the same thermodynamic database and look at another system like Al-Zn its much better:
 |
| Phase diagram prediction using cost507.tdb. Not bad! |
- Thermodynamic data/descriptions of individual phases such as enthalpy, entropy, and Gibbs free energy.
- The phases that could exist and their structure.
- Well-defined reference states (e.g.pure metal) allow for consistent and accurate calculations.
- Interaction model/parameters to describe mixing behavior of components/species.
The CALPHAD framework then enables the building of a model with these inputs to predict the phase equilibria and diagrams. You can also calculate other thermodynamic properties like heat capacity or even more useful is that the free energy models can be used within the context of phase-field simulations to evolve microstructures.
References

No comments:
Post a Comment
Please refrain from using ad hominem attacks, profanity, slander, or any similar sentiment in your comments. Let's keep the discussion respectful and constructive.