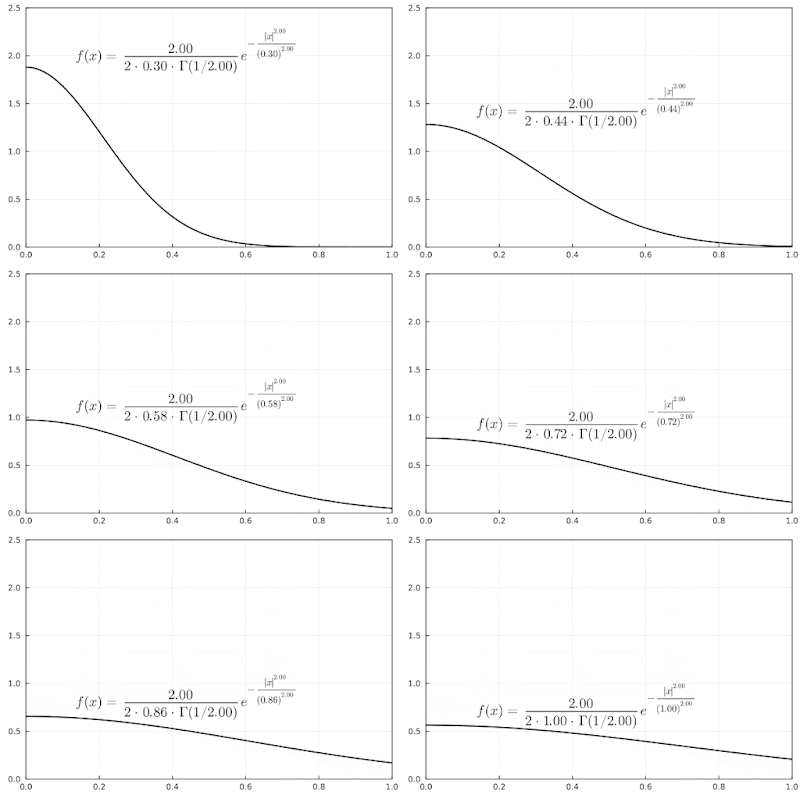
I'm working with some data with a peculiar histogram and since I'm interested in developing a probabilistic model for the data, I've become more familiar with probability density functions. At first, I thought the data just was a truncated normal distribution, but it had a plateau near low values of $x$. I was kind of interested in knowing what kind of probability density functions would give such a shape, and came across the Subbotin form pdf, which I then found is called the generalized normal distribution and is given by:
\begin{equation} \label{eq:gennorm}f(x)=\frac{\beta}{2\alpha\,\Gamma(1/\beta)}\exp\left(-|(x-\mu)/\alpha|^\beta\right) \end{equation}.
In the graph below, I'm changing the $\alpha$ parameter. As the value increases the width of the pdf increases, as one might expect.
 |
| Example of a generalized normal distribution with $\alpha$ parameter changing. |
So how do you get a more plateau-like distribution? It looks like it's the $\beta$ parameter that makes this possible. So changing this in in discrete steps of integers you see the pdf take the form as below
 |
| Changing $\beta$ to create a plateau. |
I probably already knew about this, just feel I need to write it down somewhere and as I've mentioned in an earlier post this year, I'm just trying to write more on my blog. Mainly for myself that is, but would be pleased if others enjoy it.
Reuse and Attribution
No comments:
Post a Comment
Please refrain from using ad hominem attacks, profanity, slander, or any similar sentiment in your comments. Let's keep the discussion respectful and constructive.